Does sacking the manager work? I checked every Premier League sacking since 2010
Leicester sacked the manager who had won them the Premier League, nine months after the title. In the ten games before, they had taken 0.5 points a game. In the ten after, 2.2. Chelsea sacked Frank Lampard in January 2021, doubled their points a game, and won the Champions League four months later.
Those are the stories that every board remembers, and they are why the decision feels obvious every time a run goes wrong. Before taking it, a club should know one thing: does it actually work? I did not want to answer that from memory, so I checked every mid-season sacking in the Premier League since 2010 and compared each one with clubs in the same position that kept their manager.
The short answer: a team that sacks its manager usually gets better. So does a team on the same run that does not.
How I tested it
I took every manager who was sacked, or left "by mutual consent", while a Premier League season was running, from 2010-11 to 2025-26. There were 112. A hundred had at least five league games before and after the change, and 88 had at least ten games left to measure, which is the main group.
For each of those 88, I compared points per game in the ten league games before the sacking with the ten league games after it.
That alone would prove nothing, because a team that has just had a terrible run usually improves anyway. So for every sacking I also found every other moment in those 16 seasons when a team was on the same run (the same points per game over its last ten games, within 0.15), with the same points per game for the season so far, at the same stage of the season (within five games), and did not change its manager from ten games before to ten games after. A typical sacking has about 40 of these matched teams. They are the honest comparison: the same hole, a different decision.
At first, sacking looks like it works
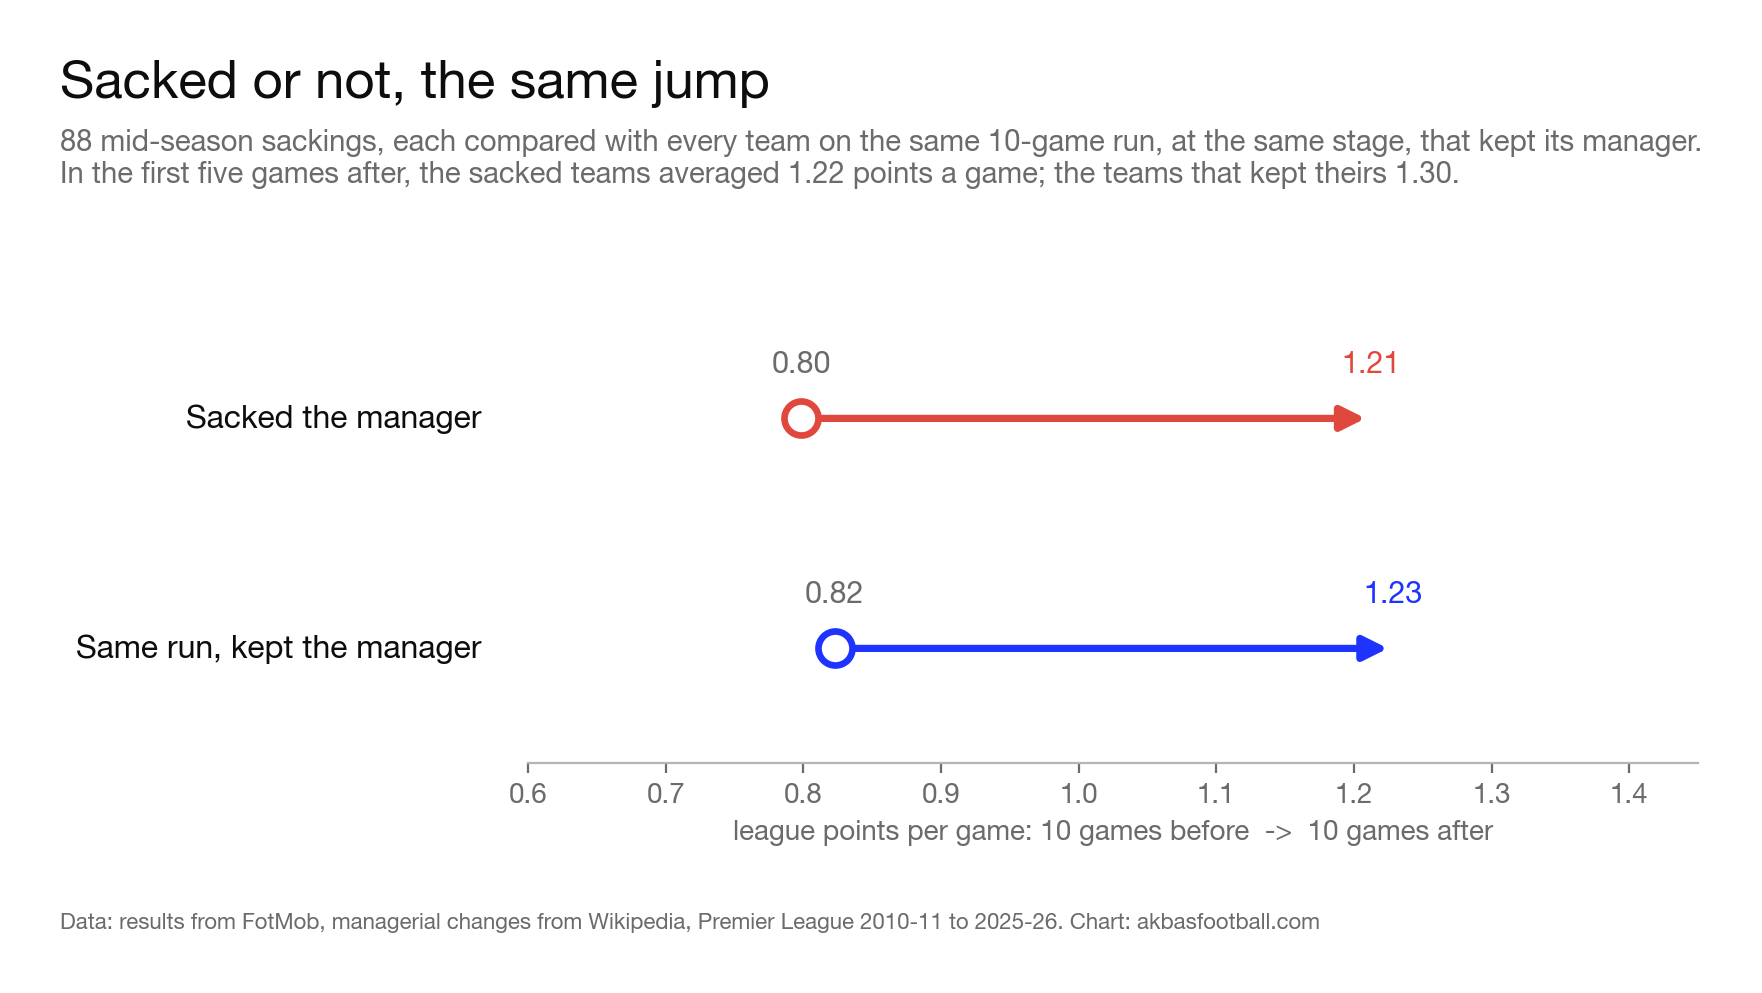
The 88 sacked teams averaged 0.80 points a game in the ten games before the sacking and 1.21 in the ten games after. Three in four of them improved. Over a full season that is the difference between 30 points and 46, between relegation and safety. It is easy to see why boards believe in it.
The teams that kept their manager did exactly the same
The matched teams that kept their manager averaged 0.82 points a game over the same kind of run, and 1.23 in the next ten games. 77% of them improved.
After the change, the sacked teams averaged 0.02 points a game fewer than the teams that kept their manager. The 95% range on that difference runs from 0.12 below to 0.09 above, which means the data cannot tell the two groups apart. Sacking the manager did not add anything a team on that run was not going to get anyway.
Is the new manager bounce real?
Not in this data. The bounce is supposed to show up straight away, so I looked at the first five games after the change on their own. The sacked teams averaged 1.22 points a game. The matched teams that kept their manager averaged 1.30.
What does show up is when clubs pull the trigger. In the game just before the sacking, the sacked teams averaged 0.18 points: it is almost always a defeat. Clubs sack at the lowest point of a run, and the lowest point of a run is usually followed by something better, whoever is in the dugout.
Why a bad run fixes itself
A run of ten games at 0.80 points a game is partly bad football and partly bad luck: a shot off the post, a deflection, a goalkeeper having the game of his life, a penalty not given. The football tends to stay. The luck does not. Over the next ten games a team usually drifts back towards its real level, and the manager who arrived in the middle of that drift gets the credit.
That is why a sacking can look like it worked at almost every club that tries it, and still make no difference on average.
At the bottom, sacking did not save them
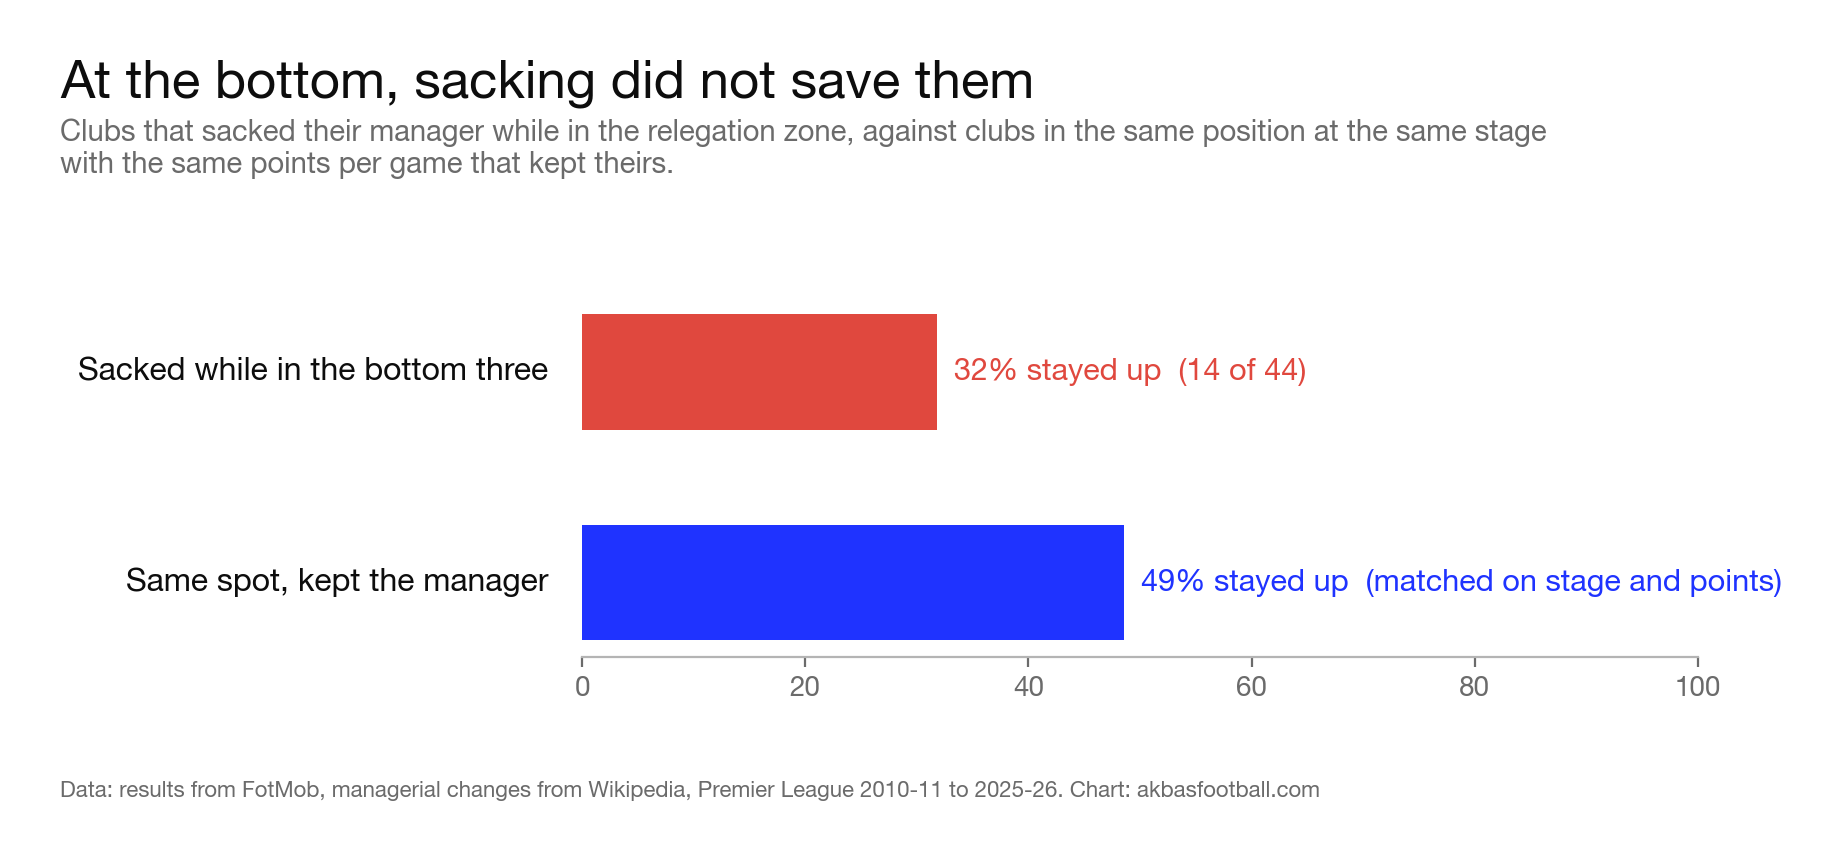
Forty-four times since 2010, a club sacked its manager while it was in the bottom three. Fourteen of them stayed up, 32%. Clubs in the same position at the same stage, with the same points per game, that kept their manager stayed up 49% of the time.
I would not read that as proof that sacking makes relegation more likely. Clubs that sack may be in worse shape in ways that points do not show. But there is no sign that it helps a club survive.
Every way I cut it, the answer is the same
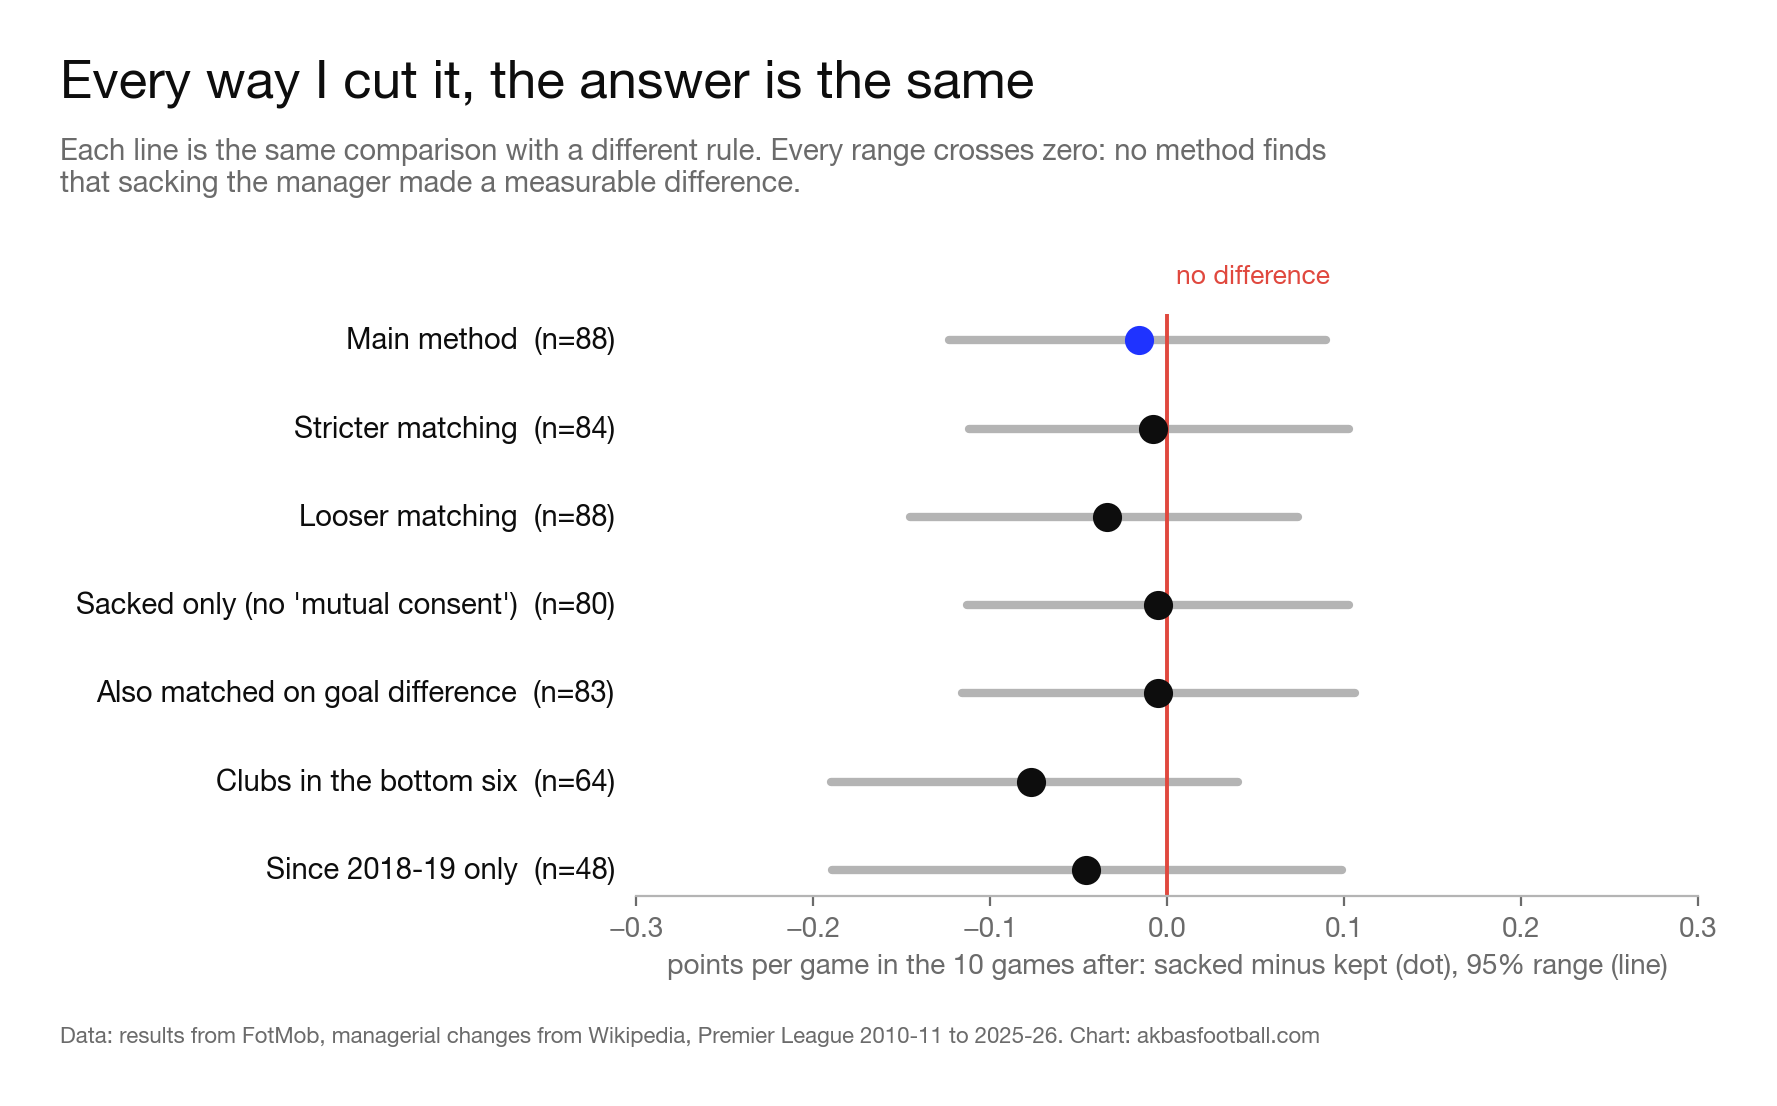
A result like this can depend on the rules, so I ran it seven ways: stricter and looser matching, counting only outright sackings, also matching on goal difference, only clubs in the bottom six, and only the last eight seasons. In every version the difference sits close to zero and the range crosses it.
The one group where it might be different is the biggest clubs. The 18 sackings at the traditional big six were followed by about 0.24 points a game more than their matched teams, with a range from slightly below zero to 0.50. Big clubs can hire from a better list, so it is plausible. But 18 cases is not enough to say, and the teams they are matched with tend to have weaker squads, which flatters the comparison.
What last season's biggest bounce shows
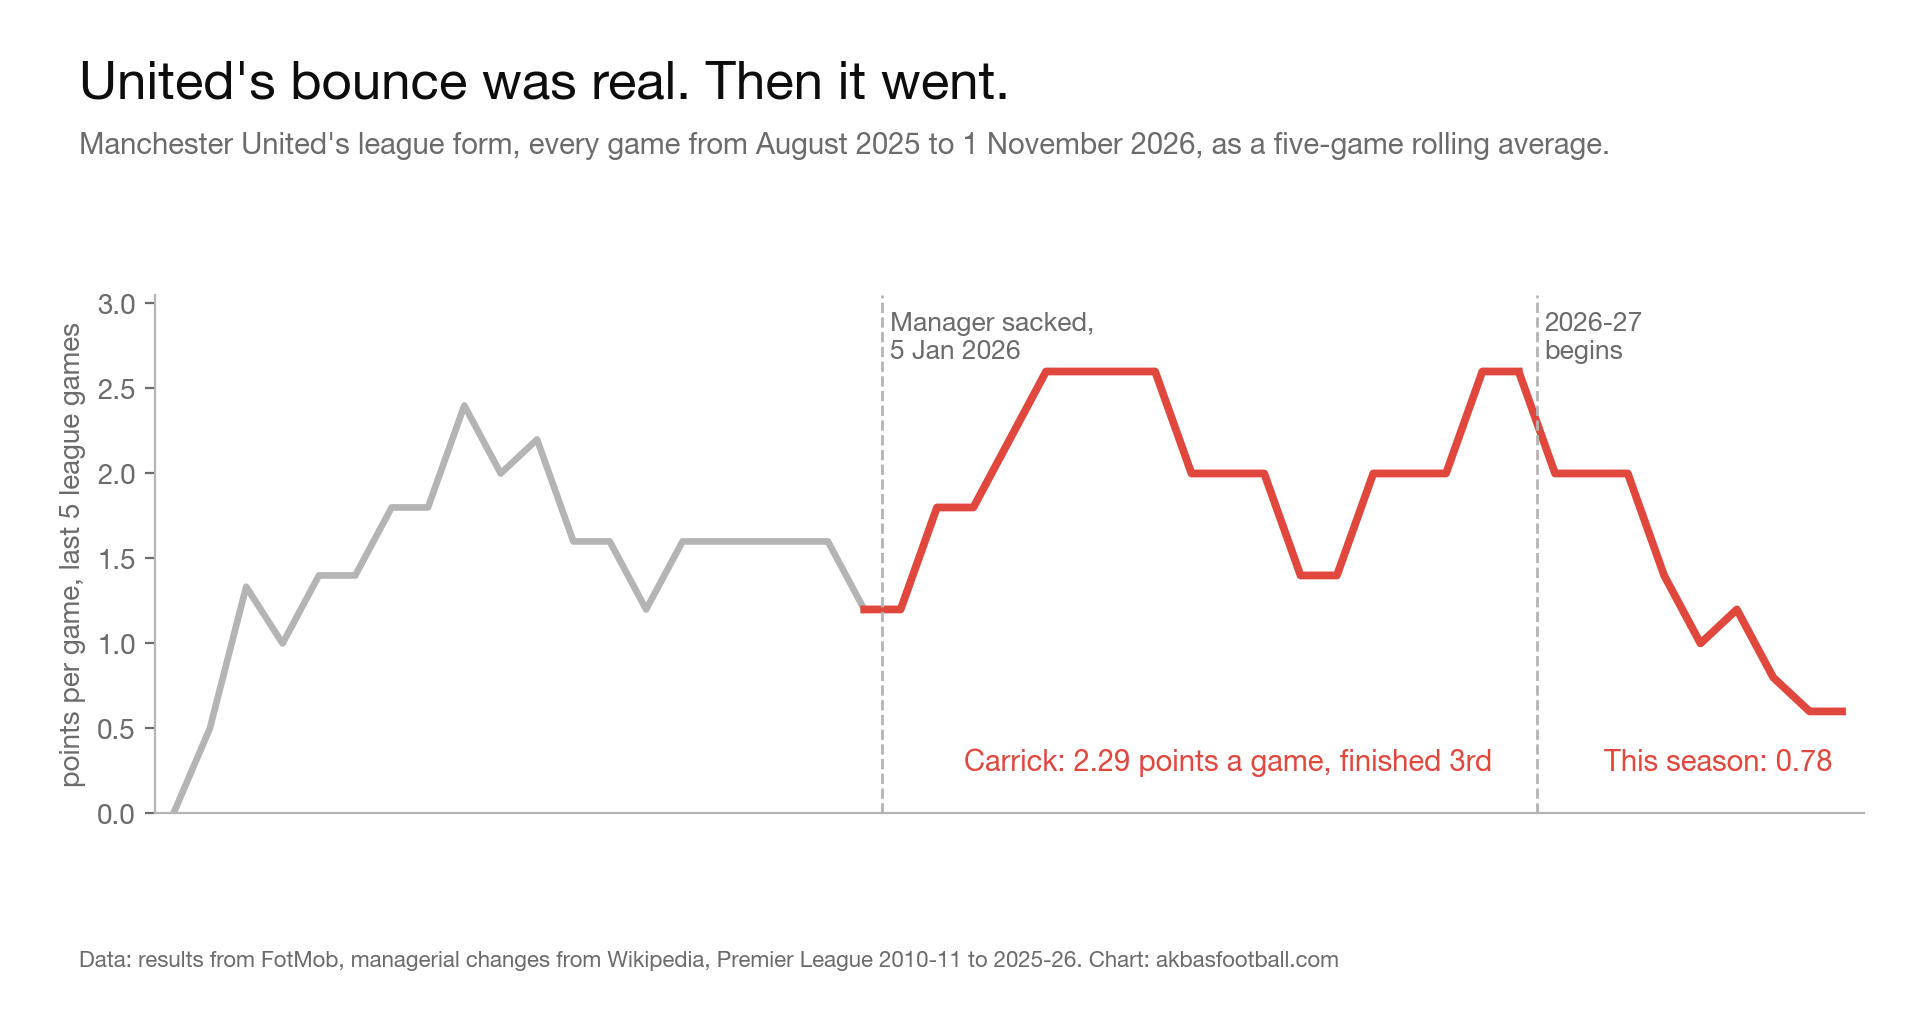
Manchester United's change last January is one of the biggest bounces in the data. United sacked their manager on 5 January 2026, in sixth place. Michael Carrick took 39 points from his 17 league games, 2.29 a game, and United finished third. Only two sackings since 2010 were followed by a bigger lift against their matched teams: United in December 2018 and Leicester in February 2017.
Ten months later the same manager has 7 points from 9 league games, 0.78 a game, and United are 17th. The bounce was real. It just was not the change of manager that made it, and nothing underneath it was fixed.
The question to ask before sacking anyone
If sacking does not change the next ten games on average, the useful question for a sporting director is not "who is the manager?" but "is this run bad luck, or bad football?"
Expected goals difference (the quality of the chances a team creates minus the quality of the chances it allows) separates the two better than the table does, because it does not care whether the shot went in. Two clubs this season show both sides of it.
Manchester United are 17th in the Premier League, but 13th on expected goals difference. Part of that gap is bad luck, and bad luck tends to turn whoever is in charge. Part of it is not: only five teams have given away more expected goals than United, and that is a defending problem a new face on the touchline will not fix by itself.
Chelsea are the other way round: 4th in the table, but only 10th on expected goals difference. Their results are running ahead of their football, and that kind of luck turns too.
My rule, if I were making the call: judge the chances, not the table. Sack a manager because the football is bad and he cannot fix it, not because the last ten results were. And if a club does sack, judge the next manager on the chances his team creates and allows over his first ten games, not on the results of his first five.
How I measured it
Results are every Premier League game from 2010-11 to 2026-27, from FotMob. Managerial changes are from the "Managerial changes" table on Wikipedia's page for each Premier League season, counting managers listed as sacked or leaving by mutual consent while the season was running, and leaving out resignations, retirements, moves to other jobs and the end of caretaker spells. Points per game use league games only. A caretaker's games count as part of the sacked club's "after", because that is what the decision bought.
Matching uses results, not expected goals, because the comparison has to work for every season back to 2010-11. The 95% ranges come from resampling the 88 sackings 5,000 times. Expected goals figures for the current season are FotMob's (Opta) after nine games.